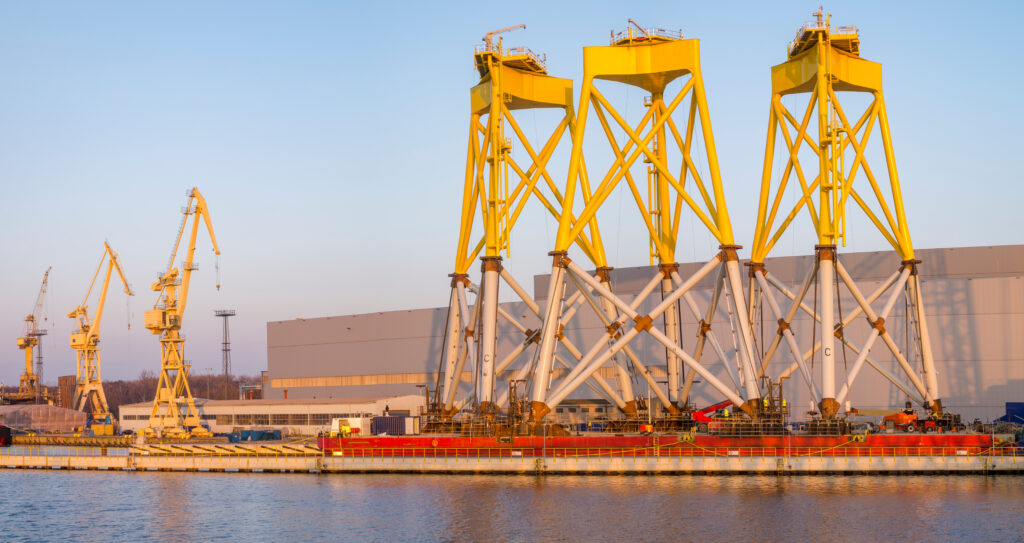
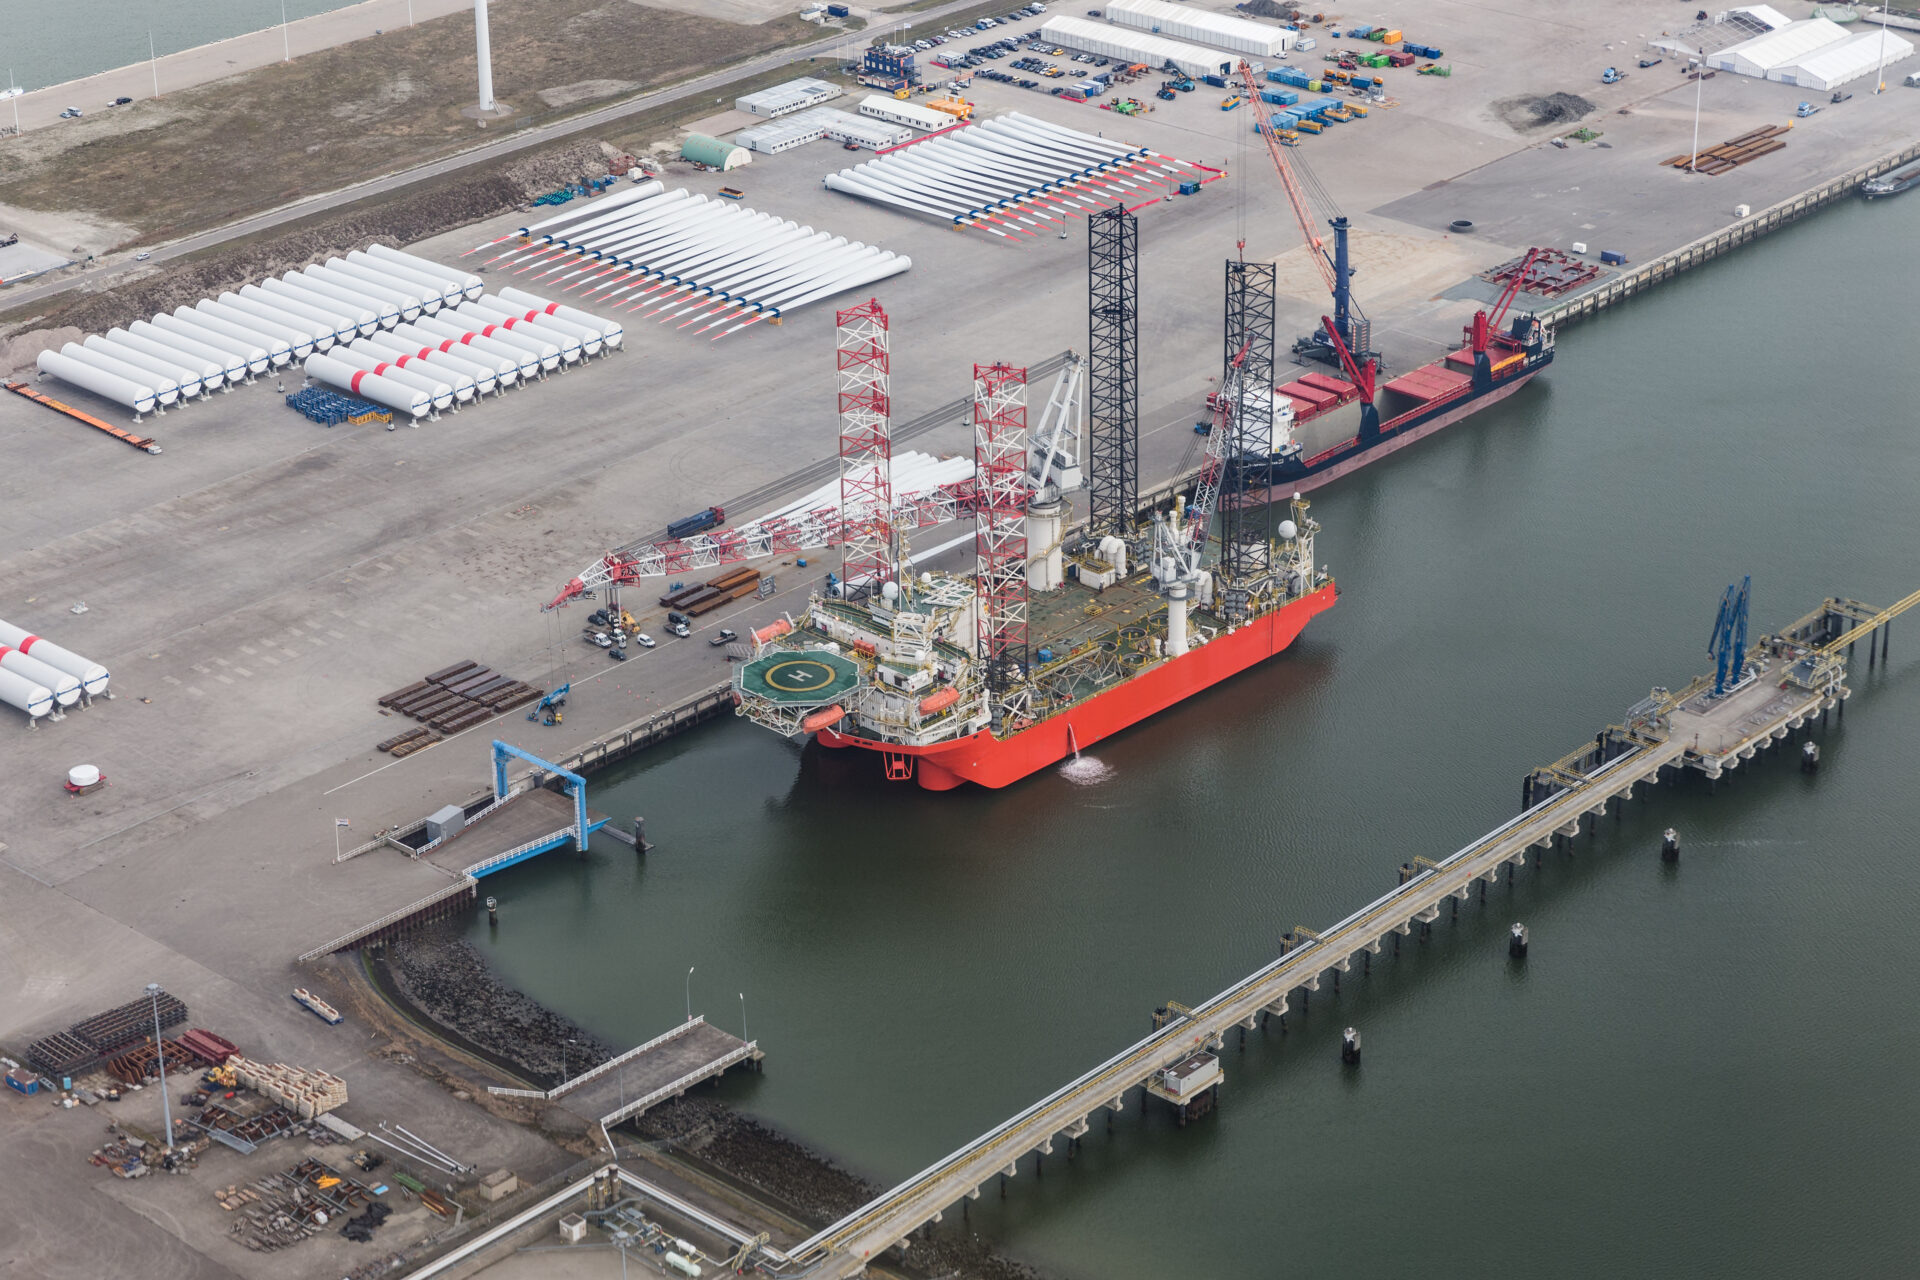
One industry expert asserts that where 600 hectares is currently available for North Sea projects, 850-1,300 hectares will be needed in 2030. A similar story can be seen in the United States of America, where an estimated 110 port development sites are needed to support offshore wind projects, but only 35 are currently in development. Port capacity is becoming the greatest bottleneck for deploying offshore wind, and as the world seeks to reach peak emissions in 2025, we are unlikely to reach our renewable targets without this key part of the jigsaw being completed.

Shoreline seeks to help its customers to accurately model how much port capacity will be required for a project in each of the ports involved, so that port capacity can be used efficiently in order to reach our common climate targets.
Introducing Shoreline Design’s port capacity functionality
Shoreline Design allows users to itemise the components required for an installation project, so the transport, assembly and installation tasks can be modelled to a high-degree of accuracy.
Inventory Management
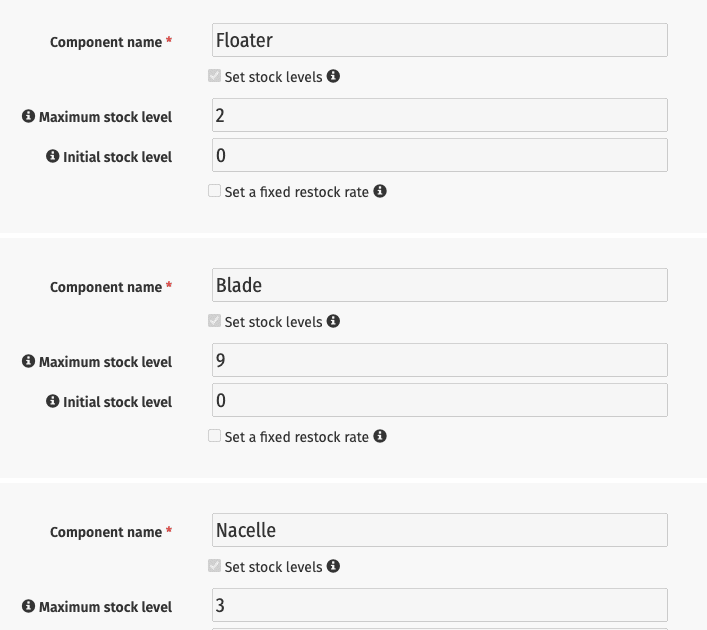
Users can model the numbers of each type of component which can be stored at a port – be it the sending port (e.g. the manufacturing location) or the the receiving port (e.g. the marshalling or pre-assembly harbor).

Since limited space is such a key problem in the industry, users are able to set a maximum stock level per component at the port. They are also able to set a constant flow of components to arrive in the port to reduce the likelihood of assembly cranes or jack-up-vessels standing idle.
Users can easily identify their biggest risk: efficient use of port or efficient use of jack-up vessel.
“Where did my components go?”
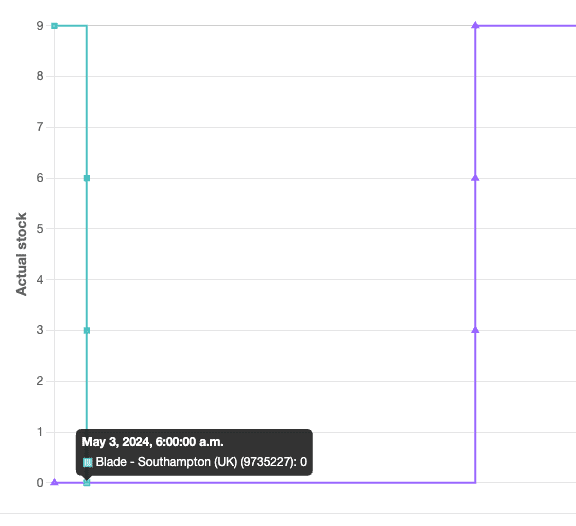
To aid verification of inputs, users can track the flow of components in and out of a port, including their consumption by an assembly task. For example, here we can see that 9 blades leave Southampton, are in transit for 3 days, and then all 9 arrive at the marshalling harbor in Spain on May 6th.

As well as tracking individual component groups, users are also able to view the total components by type at each port at any given point of time.
In this example, users can see all the components arriving at Ferrol outer harbor, being stored temporarily and then consumed in various assembly and installation tasks:

Reducing the pressure on ports
Shoreline’s vision is for a world in which it takes far less time and resources to design, construct and operate renewable energy power plants. Let us know how this feature is helping you maximise your port capacity and just-in-time supply chain!


